April 30, 2022, 11:53 am EDT
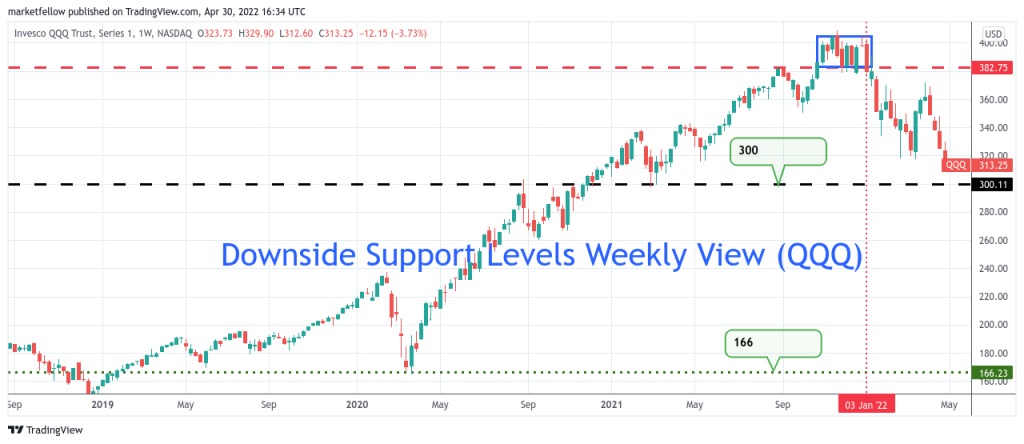
Downside Support Levels Weekly View (QQQ)
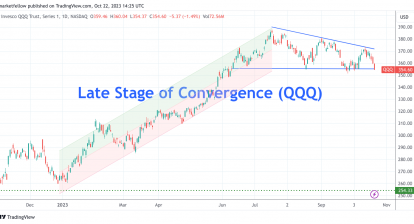
Many people want to know where is the next support when Nasdaq or Nasdaq-100 (QQQ) made a fresh 52-week low yesterday. We will pull out the weekly chart of QQQ so that we can get references.
Although potential support is 300, it looks like a weak rebound or support candidate. Also, it gets too close to the current price. Any high-volume breakdown would hammer through easily.
The next strong support or rebound level should be 166 which is the beginning of this sharp rally after the initial COVID-19 reactions in March 2020. Nasdaq made impressive +140% gains in less than two years.
Will it be too much drop for the bear markets? In our opinion, Nasdaq could drop even below the 166 level for this bear market. Considering the entire 13 years of the bull cycle (March 2009 – January 2022) Nasdaq-100 grew a total of 2,000% or 20x (from 20 to 400) gains. Thus, we do not rule out the possibility that Nasdaq falls below 166.
However, it will be the worst-case scenario for Nasdaq to wipe out majorities of gains back to 2009. Because it would be a disaster for the US economy if it happens. More likely, Nasdaq could find a bottom for this bear somewhere in the middle. Thus, let’s use 166 as reference for a potentially strong support.