September 21, 2021, 12:06 pm EDT
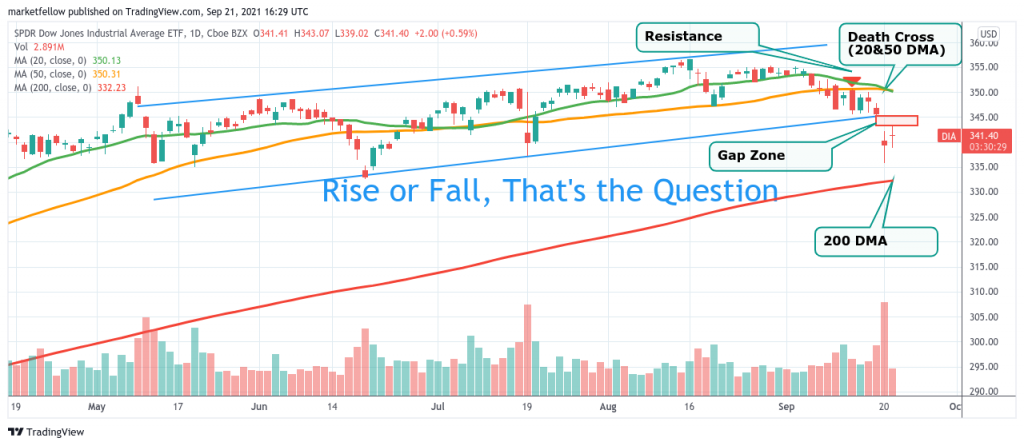
Rise or Fall? That’s the Question
Rise or fall? That’s the question everyone is concerned about after a -600 drop or near -2% down in major indexes yesterday. It could be complex to speculate from an economic or fundamental point of view. But it can be straightforward to understand and make a necessary action from technical analysis. There is a black and white answer for it that is the beauty of charting.
Here, we will use the Dow Jones Index ETF (DIA) as an example to illustrate our method. You can apply the same principle to other indexes (QQQ for Nasdaq-100 or SPY for S&P 500) or individual stocks. The method is based on moving average lines, the relationship of these lines, and gap zone.
- Day-Moving-Average or DMA Crossover: Notice 20 & 50 DMA lines formed a death cross pattern yesterday. The significance of this pattern shows short term direction (20 DMA) turned bearish (down) while medium-term direction (50 DMA) did not respond quickly enough for the change of direction.
- Support to Resistance: 50 DMA is used to be a support level for most of the days in the past year. But, it flipped to become a resistance last week.
- Gap zone: Gap down caused a major shift to the momentum. It indicates a sudden surprise with a rush of actions to either get in or get out. This is what we saw yesterday: a gap down zone. The direction is set to the downside unless this gap can be filled. Usually, it is not easy to fill the gap and change direction again.
- Long Term Support: 200 DMA is the last defense for bulls. It should be a strong support level to offer either rebound or support. Failure to hold this level means the bulls are officially dead.
Based upon the above foundations, we can see DIA is already struggling to survive due to death cross, 50 DMA resistance and gap down.
If bulls want to fight back, they need to overcome key levels: 345 (gap zone) and 350 (50 MDA). This is a difficult task.
Or, DIA may be up-and-down between 345 gap zone and 332 (200 DMA). Sideway actions are still signs of weakness because it is below 20 & 50 DMA and gap-down zone. Eventually, bears may launch another attack.
Finally, DIA may keep going down to touch 200 DMA or drop below it. Needless to say, bears are coming when it happens.
In summary, the bias is on the downside. Bulls need to move above the 345-350 level to reverse the trend. If it does not happen soon enough, a few days to a few weeks, then it would be at great risk for another breakdown to touch its final verdict, 200 DMA.
We can use this analysis to decide what to do with our portfolio.