December 30, 2020, 10:21 am EST
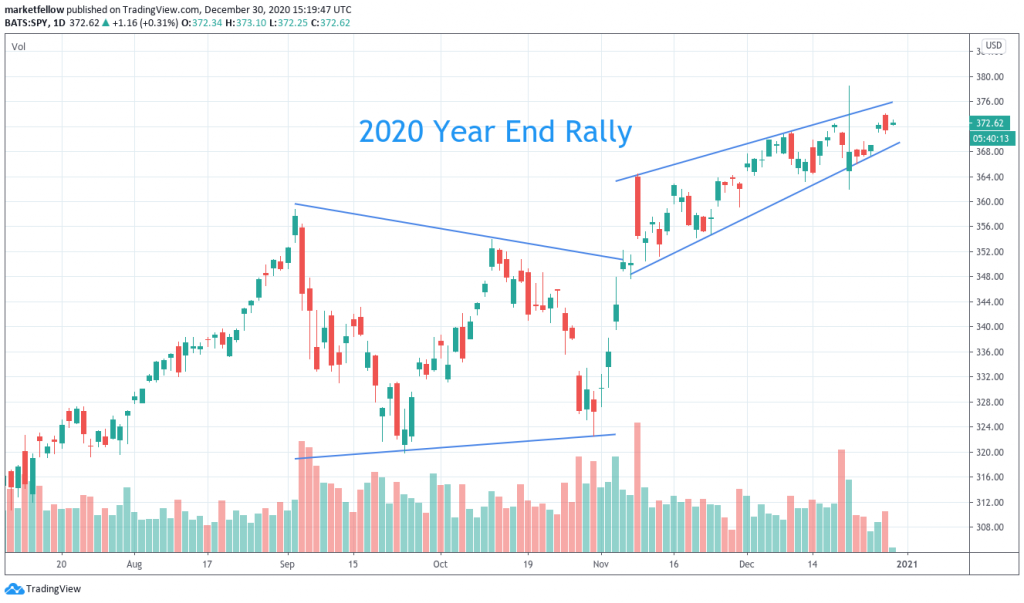
2020 Year End Rally
Stock market squeezed its power for the last few trading days of 2020 to a new high zone. New highs always mean bullish but it is also important to know when the party will be over or interrupted so that you are not the last one to come with regrets.
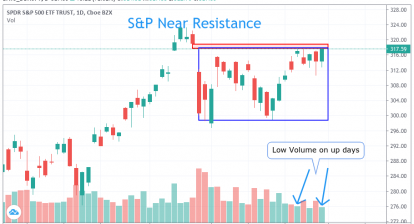
Looking into this chart of S&P 500 ETF (SPY), we can see a consolidation period during September – October two months duration. Then, SPY made a strong two rally in November – December from 348 to 376 or +8% gains. Rising wedge pattern is formed that looks bullish because it is all the way up.
However, it is important to note that a lower boundary marks a reminder of potential breakdown. In this setup, its level is 368.
In summary, we can keep a bullish bias for rising wedge patterns until the lower boundary is taking out or broken. It would be the time to take a more conservative strategy.