July 11, 2020, 7:31 pm EDT
Bullish Price Action
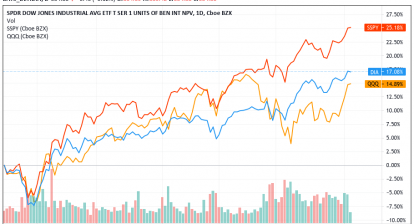
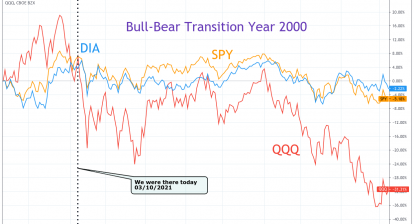
While Nasdaq made new highs almost every day in the past few weeks, S&P and Dow Jones also approached their relative resistance levels before making new record high again.
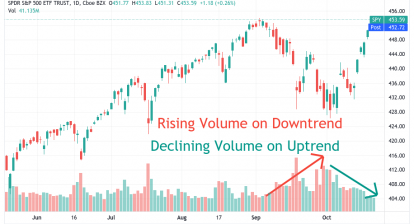
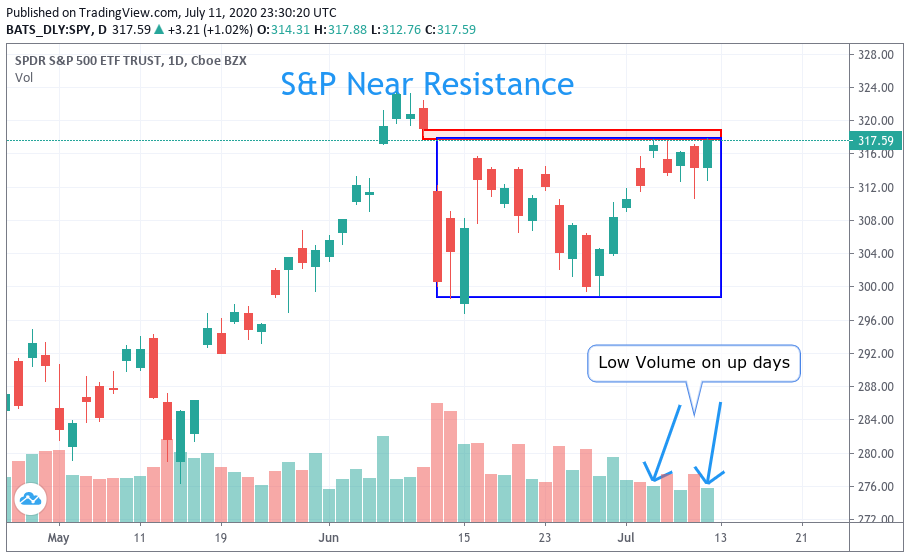
Please check the S&P 500 ETF (SPY) as an example. We can see S&P is only inches away from breaking the thin resistance zone and reaching all time high. Thus, price action and pattern are very bullish.
But, pay attention to volume patterns. It reveals that previous up days came with low volume. It means institutional investors are missing from pushing S&P to new high, at least it does not happen yet.
Next week will be important to watch from distinct angles. First, breaking out from the resistance zone would be bullish because there will be no more resistance. Second, we will need to check out the volume pattern in accompanying with price action to see what will be the follow-up motivation.