October 21, 2021, 5:53 pm EDT
Price and Volume Patterns
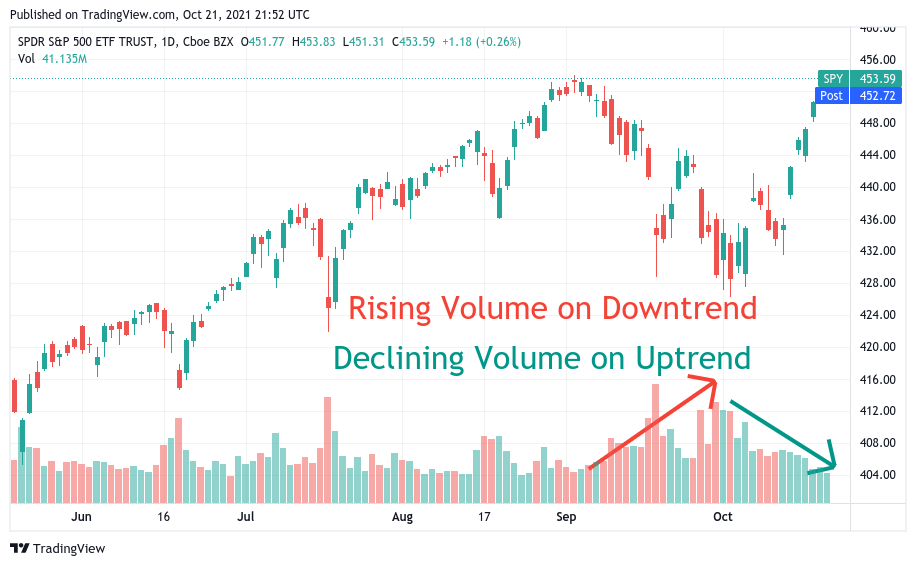
Volume means the weights when interpreting charts for the stock markets. Rising volume means strengthening and declining volume equals weakening. Usually, rising volume on the uptrend indicates the uptrend is getting more upside power. Rising volume during the downtrend says bears are getting stronger. We can say declining volume during the uptrend is a weak rally. Similarly, declining volume in the downtrend could mean exhaustion on bears.
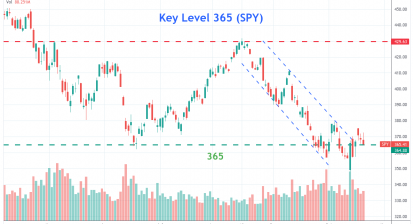
Applying this method to look at S&P 500 charts for both price and volume patterns we can see an interesting pattern as shown. That is “Rising Volume on Downtrend and Declining Volume on Uptrend”
This annotation provides another angle to exam the intrinsic strength of the S&P 500. It reminds us not to get excited about this 6-day rally. Moreover, higher volume on the downtrend could be a warning signal even we are at a record high level for the S&P 500 index.
In summary, market participants are cautious about this rally. So, it is indeed a bullish bias for the major indexes at the record high zone. Volume patterns suggest more prudent actions.