January 9, 2024, 11:15 am EST
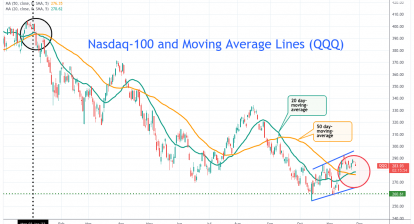
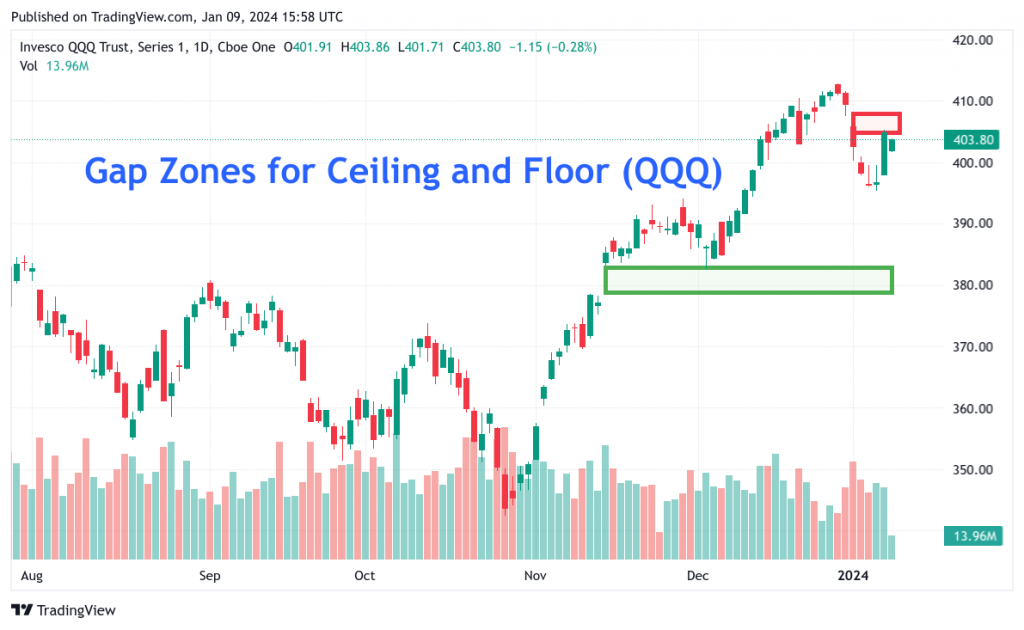
Gap Zones for Ceiling and Floor (QQQ)
Gap zones, either gap-up or gap-down, provide important information for the market reactions on volatile days. These hints are useful for technical analysis as references for on upside limitation or downside support.
Gap zones occurred when the market opened at unexpected momentum that carried a strong force to jump much higher or lower than the previous days. These events do not happen normally. Because it requires a powerful action to start a day with a gap-up or gap-down following a news or event.
In the featured chart we use Nasdaq-100 (QQQ) as an example where we can see both a gap-up on 11/14/2023 and gap-down on 01/02/2024. The gap-up day brought QQQ to above 380 level and the gap-down dragged all-time high QQQ to below 410 level.
Usually, the gap-up forms resistance and gap-down constructs support for the days to come.
The zone between them may take a while for a stock to stay there. Therefore, we can consider the 380-410 area as a range-bound area for the days to come. Since QQQ is located near the top of these two gaps, it is more likely QQQ will go down rather than go up. To break through either zone requires another strong force to happen which could be another unusual event. In most conditions, the underlying stock would honor the zones by staying below the gap-down zone and above the gap-up zone for a while.
Therefore, the bias for the short-term (days) and medium term (weeks) are relatively bearish based on the information from these gaps.