December 20, 2023, 3:42 pm EST
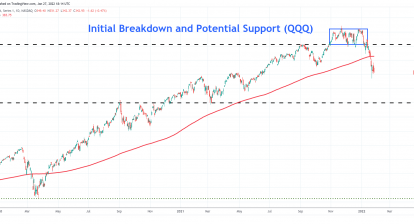
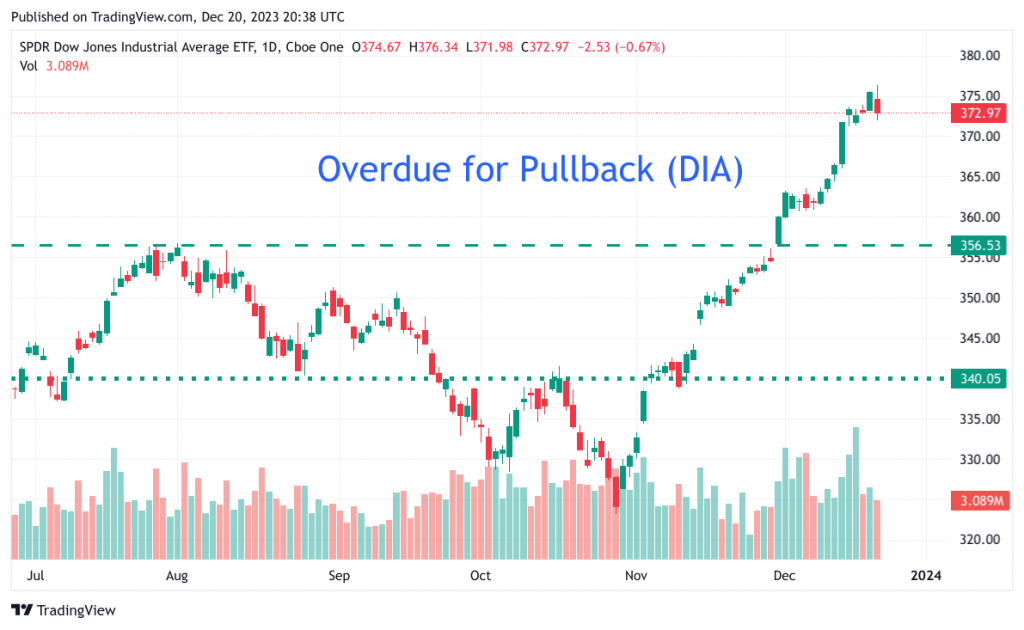
Overdue for Pullback (DIA)
It is one of the greatest rally with +16% straight-up gains within two months.
As shown in the Dow Jones ETF (DIA) chart where we can see the run is like a non-stop rush pattern. There is no proper base for this bullish action because it was driven by the cooling effect of inflation. More importantly, the improved inflation data gave the Fed reserve a reason to pause the rate hikes. The Fed can also begin the talk on possible rate cuts in 2024.
Needless to say, it was a turning point for the stock markets. However, it was a big surprise that it can carry such big gains under the shadow of on-going wars and unstable geopolitical environments.
It would be hard to know where are proper downside targets but we can draw two horizontal lines from previous tops and congested zones to be 356 and 340, respectively.
If the DIA can find support at 356 and bounce up, then it is still a bullish bias. Between 356-340 receives a neutral bias. Below 340 means all upside power is gone and bias adjusts to bearish.
Monitoring the volume pattern during the pullback would be helpful to determine the strength from both sides. Political events could also magnify the downside speed which could be critical at the key support levels (356, 340).