January 22, 2022, 11:13 am EST
Bull-Bear Transition Series 1 – Valuation
It should be time to mention about Bull-Bear transition after all major indexes broke through their 200 day-moving-average lines. Even though the indexes did not reach the conventional definition of the bear markets of -20% down from the peak, (year-to-date DJIA -5.7%, S&P -7.5%, Nasdaq -12%) there are many symptoms available to show the end of bulls and the start of bears. Thus, we would have a series of articles to talk about Bull-Bear Transition from the perspectives of fundamental, economic, and technical analysis. We are able to see how it happens based on facts, data, and historical events. We start with the valuation.
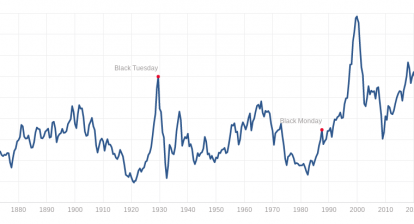
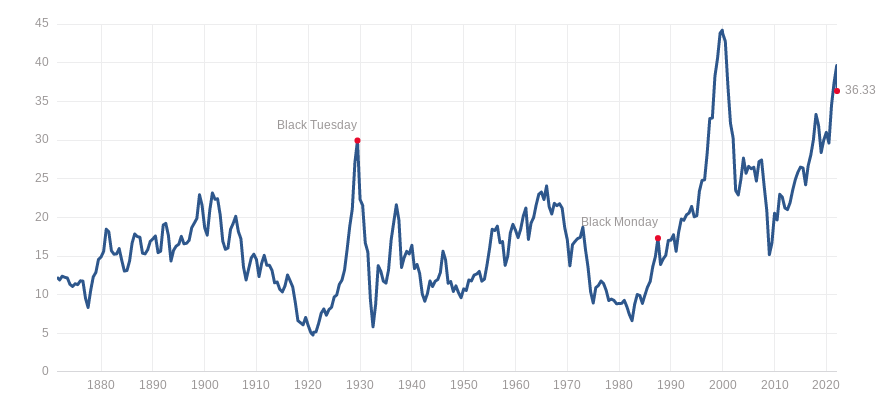
One most common way to value a company is through its Price to Earnings ratio or P/E ratio. There is also another price-earnings ratio that is based on average inflation-adjusted earnings from the previous 10 years, known as the Cyclically Adjusted PE Ratio (CAPE Ratio), Shiller PE Ratio. Please see the featured chart of S&P 500 through the past 100+ years of history (Source: https://www.multpl.com/shiller-pe)
With its mean and median values around 16-17 levels, we can see there are three peaks that occurred in 1929, 2000, and 2022 or now. Those periods the P/E reached 30 or 40 levels. It simply means overvalued. The other way to look at is that the stock prices surpassed earnings in abnormal behaviors. Definitely, it is not sustainable. Therefore, the previous two periods, 1929 and 2000 ended up with a major crash of bear markets for the following couple of years.
- 1929 Bear: -87% (Dow Jones from 381 to 51)
- 2000 Bear: -78% (Nasdaq from 5132 to 1108)
This time the longest bulls that started on March 2009 carried all indexes to numerous record highs as we witnessed three weeks on Dow Jones. Its P/E is about 35-40. It would be reasonable to guess what could happen in the next 1-2 years.
There are mega-companies these days whose market capitalization is above a trillion-dollar including MSFT, AAPL, AMZN, GOOGL, etc. Furthermore, TSLA has a P/E of 322. It is true that they have earning powers and new technology. But, maybe they are overvalued at this moment. Even NFLX was down -22% yesterday or more than -40% compared to two months ago, it could have more space to go during the bear market cycle. Thus, trying to catch a falling knife involves a high risk because of its valuation.
The other way to look at this P/E chart is that when it reaches 10-15 level it could be an ideal place to invest heavily.
In summary, a near record-high valuation is a dangerous sign like we are going through now. Also, it takes a full bear cycle to reset its proper P/E. So, be conservative and cautious about this bull-bear transition according to the valuation.