November 3, 2022, 4:56 pm EDT
Rebound Failure and Potential New Lows For Nasdaq
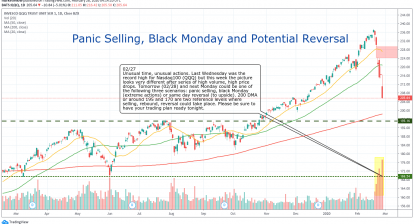
Rebound is an effort to change the downward spiral. It is not easy as we thought. Because there is a downside momentum build-up along the downtrend. Rebound failure indicates a give-up mood that usually leads to new lows. Furthermore, it could open up another major trend.
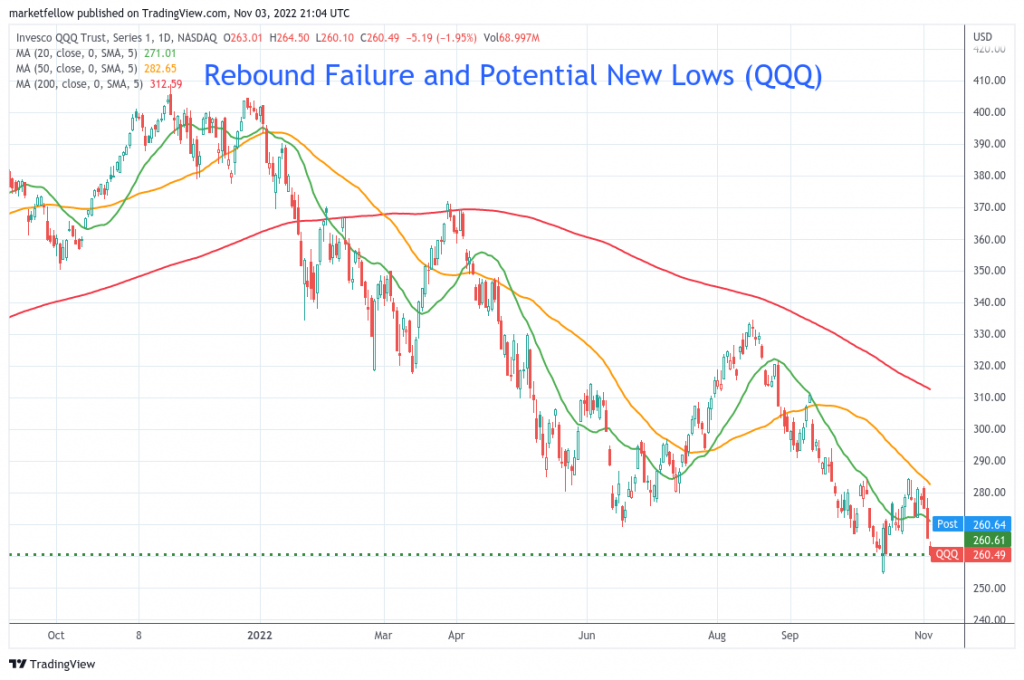
Let’s use the Nasdaq-100 index (QQQ) as an example to demonstrate this situation.
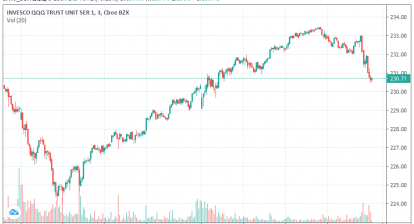
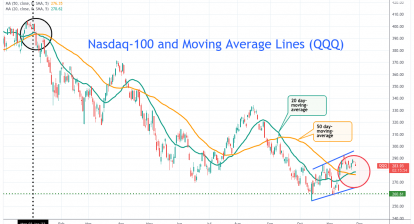
As shown in the featured chart of QQQ, we can see QQQ is located at 260 which is the low of the entire chart except for the 10/13 low. It went down all the way from about 400 levels in December 2021 or January 2022. So, it made about -35% YTD performance. However, it may not be the bottom.
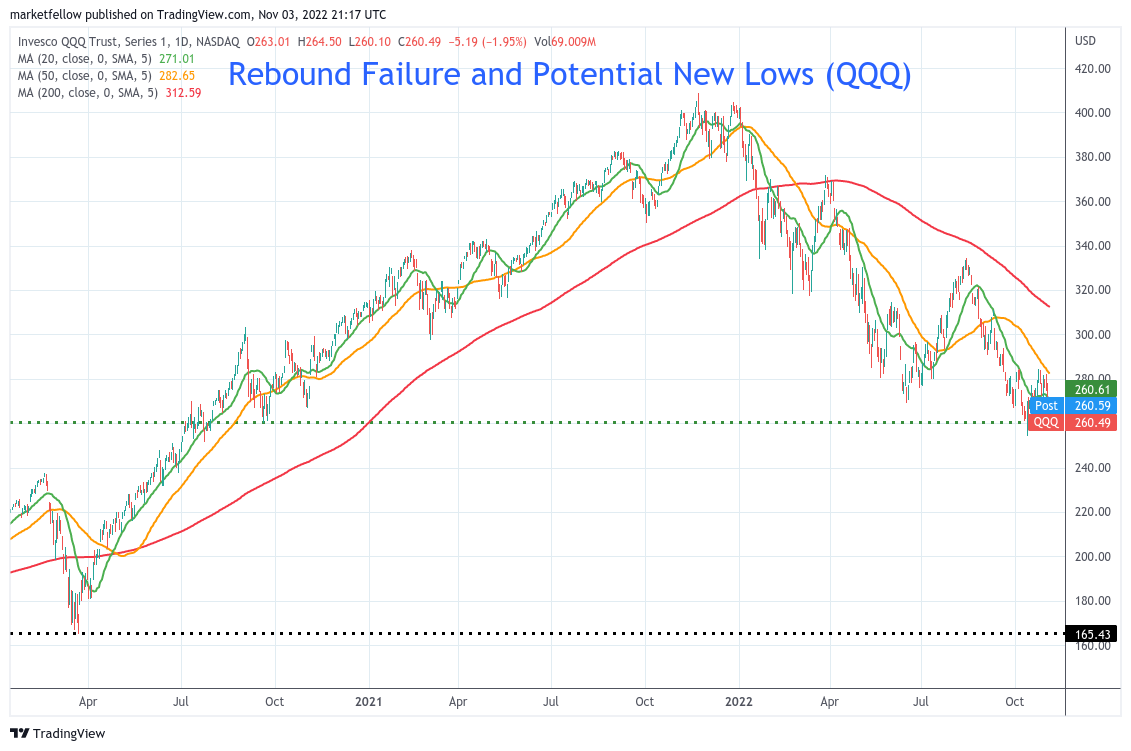
Breaking down below 260 would open up a fresh new low and downtrend. In our opinion, the strong support for QQQ is 165 which is the low of 2020. Moreover, it could go even deeper than that but 165 should provide certain support for a strong rebound.
Therefore, it is not a good idea to try to predict the bottom. The problem with these technology focus indexes is that their cost of borrowing money increases significantly because of rising rates. Also, the demand for their products or services decreases with the shrinking economy. When people lose their jobs or incomes, it is unlikely they will buy more stuff from Amazon, iPhone 14, or buy $1500 Meta Quest goggles.
The best strategy is to avoid buying and holding these stocks during the bear market.