September 21, 2023, 4:05 pm EDT
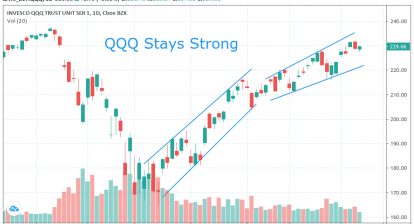
Head-and-Shoulder Pattern (QQQ)
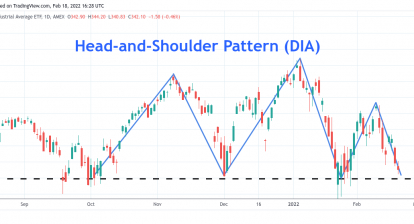
One of the most frequent patterns for market participants to see the coming storm is the head-and-shoulder pattern in the stock market.
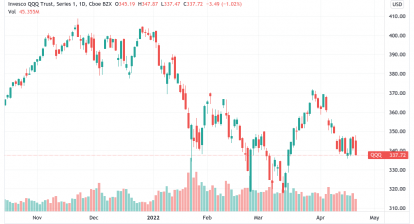
As shown in the featured chart of Nasdaq-100 ETF (QQQ) the pattern was outlined clearly. The shoulders and head can be easily recognized with the neckline ready to break. It means that another big drop could trigger a major sell-off for a major downtrend.
Basically, mid-July marked the peak and early September was the last chance to get out at the high point of 2023. It is very important to recognize this pattern and prepare for it. Particularly, protect your portfolio and minimize the risks when the neckline is broken.
Fundamentally, over-stretched rally, inflation, higher rates, global slowdown, record high debts, and geo-political uncertainty, are going to work together to pull down the market.
We also mentioned about IPO market where we can see both ARM and CART are struggle to depend on their IPO prices.
There are many things to watch but chart pattern is a simple method to pay attention where it gives a picture of crowd behavior in the past that could repeat in the future.