June 16, 2022, 7:20 pm EDT
Where Are the Support Levels?
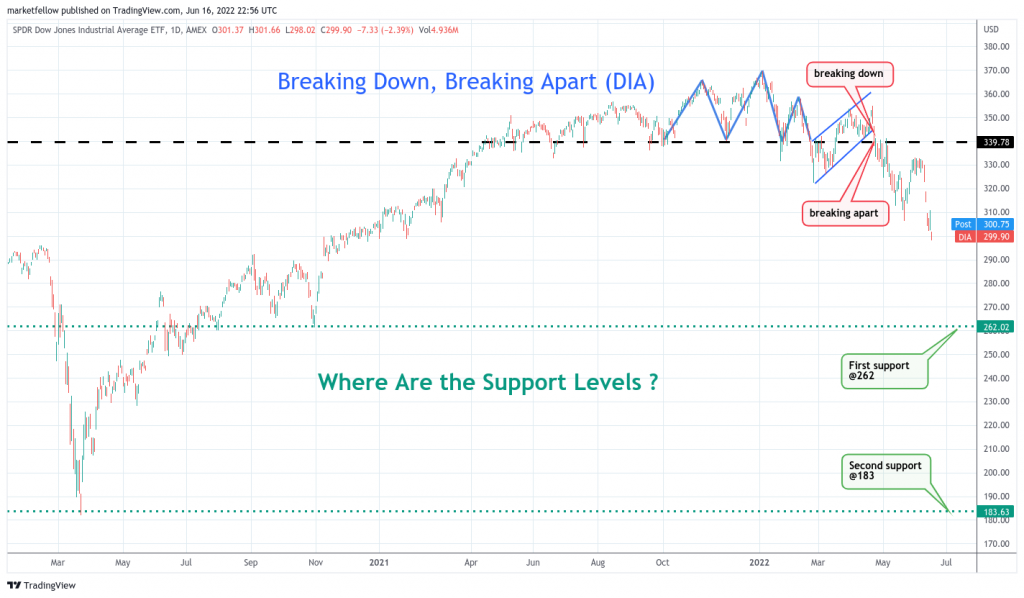
If you still remember we mentioned on April 22, 2022: “DJIA is at the beginning of much worse bear markets for the next one or two years.” 04/22 Breaking down, breaking apart (DIA), then today we would like to mention about coming support levels for DIA.
Indeed, today’s drop of -741 points in the Dow Jones index seemed to be significant. S&P 500 and Nasdaq also retreated about 3% to 4% range. However, DIA 300 is still far from meaningful support. Thus, rushing into the stock markets may cause loss at this moment.
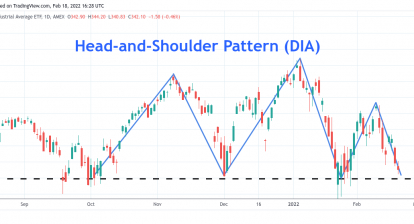
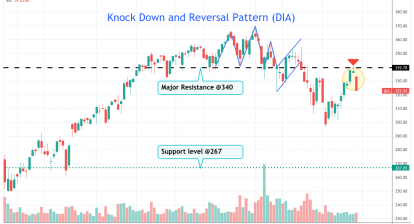
Looking back to our previous annotation on the critical line at 340 which was both the neckline of head-and-shoulders pattern and breaking-down, breaking-apart (meaning rebound failure), it can be visualized that there is no strong support until 262 level. 262 served as the beginning point for the final rally from the 2020 bottom. Biden and his team worked hard to print and spend more money for the bulls’ final party to play on. Also, it will reach about -30% down from the top (from 371 to 262) for DIA, making investors pained enough to take a break. Thus, it could form the initial support for the bear market.
However, we do think DIA could fall further for the full reset to reach the COVID-19 bottom around 183 level. 193 should offer strong support and rebound. Imaging many people watch -50% down for the Dow Jones index (from 371 to 183) that should be a terrible experience. In our view, many weak companies who do not have earnings are dead already at that time. Therefore, the stock markets should be able to take a break from the fatal selloff.
Will DIA 183 be the solid bottom for this bear? It is hard to say today. We need to check the economic data to determine. Most likely, it could offer a relatively safer entry point when it happens.