February 18, 2022, 11:30 am EST
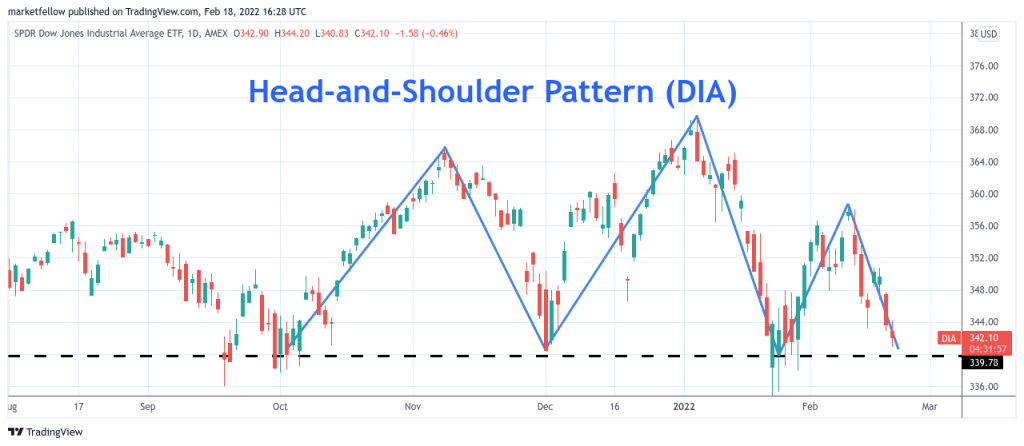
Head-and-Shoulders Pattern (DIA)
The head-and-shoulders pattern is probably the most famous pattern for topping out based on technical analysis on the stock charts. After 12 years of the bull market since March 2009, we can witness whether this classic pattern makes sense to signal the end of the bull.
- Five months head-and-shoulder pattern is near completion for DIA
- The head was located at 370. Two shoulders were defined with its neckline at 340
- This is a very important moment to watch how Dow Jones behaves on its key level 34000 (DIA 340)
- Falling below 340 will conclude the 12 years-old bull cycle. In addition, the neckline 340 will form a resistance level or the beginning of the bear market.
Recognizing this pattern is helpful because it clearly defines the bull-bear transition. Furthermore, the neckline provides a key level to watch at the time of breakdown. It also gives us a sense of the strength of the bull/bear during rebound. By forming a resistance level, it confirms the correctness of the pattern.