September 16, 2021, 10:24 am EDT
Attitude Changes:50 Day-Moving-Average
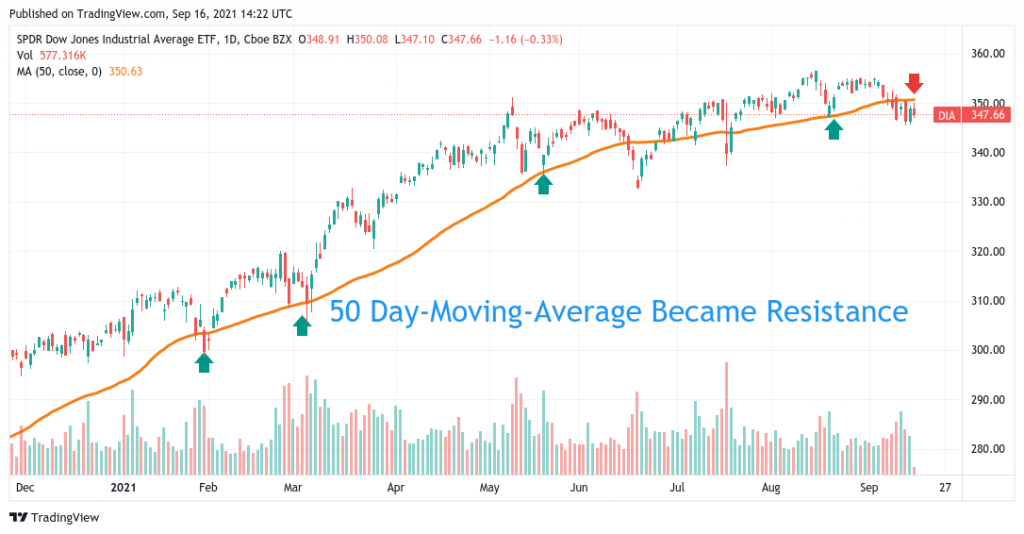
It is important to notice the change of attitude when dealing with people or the environment because it could be a hint for the coming direction. Especially, it used to be a support but it became a resistance. We are talking about the 50 Day-Moving-Average (DMA) line for a stock chart.
50 DMA is a key indicator for a medium trend. It used to be a support or rebound for more than a year. Notice Dow Jones Index (ETF: DIA) always rebounds quickly when touching this orange line. Even it drop below it in June and July, it quickly recovered and stayed above it.
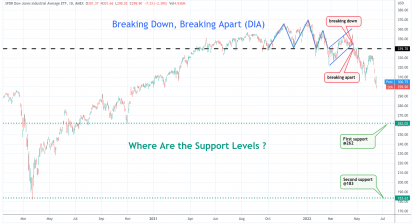
But, this time looks different. Not only it did not rebound, but it also stayed below for the 5th day and this 50 DMA seemed to become a resistance level instead of support. If this is true for the next few weeks, then it should be a warning signal for the change of direction, from uptrend to downtrend.
As we had mentioned in our article above 200 DMA that using long term (200) breadth indicators: Percentage of Stocks Above 200 Day Moving Average, it also pointed to weaker sentiment since February 2021. Most likely, these are early reminders for traders and investors to be prepared that direction may be about to change.