Charts
Chart pattern, indicators, drawing, etc
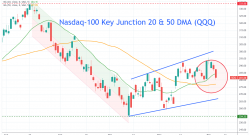
Stock Charts: Nasdaq Key Junction
December 6, 2022, 8:32 pm EST Nasdaq Key Junction Two days of bloodshed sell-off hurt Nasdaq significantly. Especially, Nasdaq performed much worse than its peers Dow Jones and S&P 500 by a wide m...
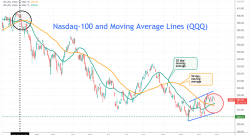
Stock Charts: Nasdaq-100 and Moving Average Lines (QQQ)
November 28, 2022, 2:14 pm EST Nasdaq-100 and Moving Average Lines (QQQ) Nasdaq and Nasdaq-100 are the leaders when bulls are in charge of the upside. But, they are also leaders in the bear markets wh...
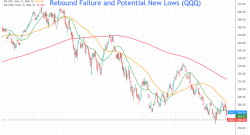
Stock Charts: Rebound Failure and Potential New Lows For Nasdaq
November 3, 2022, 4:56 pm EDT Rebound Failure and Potential New Lows For Nasdaq Rebound is an effort to change the downward spiral. It is not easy as we thought. Because there is a downside momentum b...
Stock Charts: Are Bulls Coming Back?
October 31, 2022, 2:01 pm EDT Are Bulls Coming Back? “Are Bulls Coming Back?” After Dow Jones rallied 15% gains in 12 trading days, this is the question many questions may asked. Especially, Dow Jones...
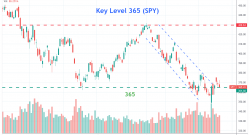
Technical Analysis: Key Level 365 (SPY)
October 20, 2022, 10:37 pm EDT Key Level 365 (SPY) S&P 500 ETF (SPY) broke the 365 level about a month ago. Then, it swings in both directions for almost a month without progress. It is important ...
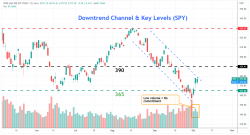
Stock Charts: Downtrend Channel & Key Levels (SPY)
October 5, 2022, 5:16 pm EDT Downtrend Channel & Key Levels (SPY) Technical analysis is helpful when you see the pattern and key levels. By recognizing those facts from the chart, a market partici...
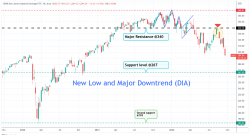
Stock Charts: New Low and Major Downtrend (DIA)
September 23, 2022, 12:27 pm EDT New Low and Major Downtrend (DIA) While Dow Jones is making a new 52-week low with -600 points down now, it opens up a possibility for a major downtrend ahead. Althou...
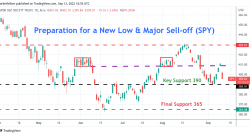
Stock Charts: Preparation for a New Low & Major Sell-off (SPY)
September 13, 2022, 2:56 pm EDT Preparation for a New Low & Major Sell-off (SPY) The stock market prepares for a new low and major sell-off as shown in the featured chart for the S&P 500 ETF (...
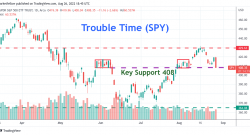
Stock Charts: Trouble Time (SPY)
August 26, 2022, 2:52 pm EDT Trouble Time (SPY) Trouble time is coming to the stock markets. As shown in the featured chart of S&P500 ETF (SPY), key support level at 408 is being challenging and t...