Charts
Chart pattern, indicators, drawing, etc
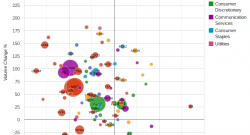
Stock Volume: High Volume Turnover on Mega Technology
September 17, 2021, 6:27 pm EDT High Volume Turnover on Mega Technology Volume matters. When the trading volume of a stock is far above the average volume above 50% or 100%, it means that a large crow...
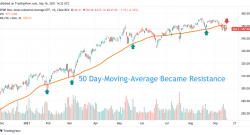
Stock Chart: Attitude Changes – 50 Day-Moving-Average
September 16, 2021, 10:24 am EDT Attitude Changes:50 Day-Moving-Average It is important to notice the change of attitude when dealing with people or the environment because it could be a hint for the...
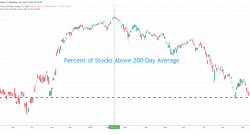
Stock Chart Today: Deteriorated Breadth Indicator
September 11, 2021, 7:49 pm EDT Deteriorated Breadth Indicator Although stock markets made a new record high earlier this week, breadth indicators have deteriorated consistently since February 2021. I...
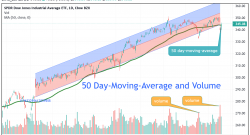
Stock Chart: Technical Analysis with Moving Average and Volume (DIA)
July 20, 2021, 9:04 pm EDT Technical Analysis with Moving Average and Volume (DIA) Nobody can give you a sure answer on what is going to happen for the stock market for tomorrow, next week, or the end...
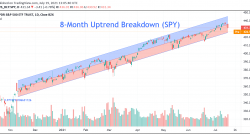
Stock Chart: 8-month Uptrend Channel Breakdown (SPY)
July 19, 2021, 9:06 am EDT 8-month Uptrend Channel Breakdown (SPY) A major uptrend rally started after the US presidential election on 11/02/2020, is at great risk of breakdown. As shown in S&P500...
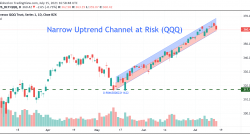
Stock Chart: Technology Weak Again
July 15, 2021, 1:03 pm EDT Technology Weak Again Technology stocks, represented by Nasdaq100 (ETF: QQQ), are relatively weak again today with -0.9% drop as of now compared to a flat status in Dow Jone...
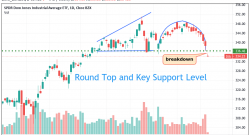
Stock Chart: Technical Damage (DIA)
June 18, 2021, 9:54 am EDT Technical Damage Dow Jones lost another -400 points this morning that caused severe technical damage to its chart as shown (ETF: DIA). Roundtop shape broke its 3-month key s...
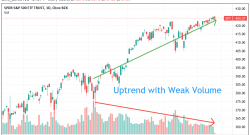
Stock Chart: Uptrend with Weak Volume
June 15, 2021, 10:47 am EDT Uptrend with Weak Volume Uptrend makes people excited. But volume tells you the power behind the rally. Volume represents transactions on a given day. Only big players or i...
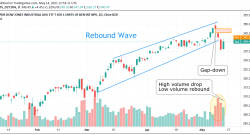
Stock Chart Today: Rebound Wave
May 14, 2021, 8:54 am EDT Rebound Wave The stock market began its rebound wave after three red days. Here are two factors to check in the next few sessions to determine if this rebound will re-charge ...

