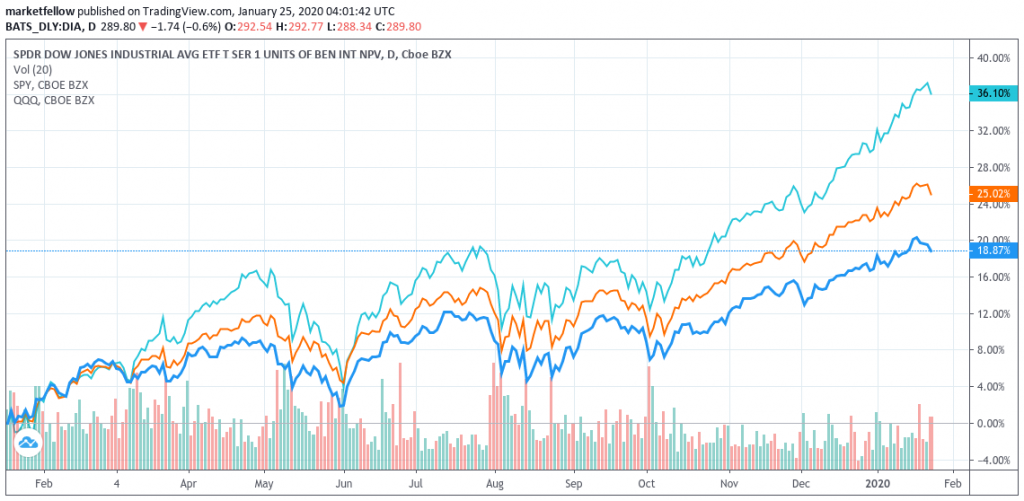
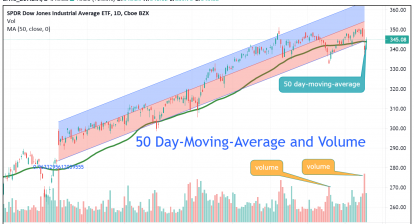
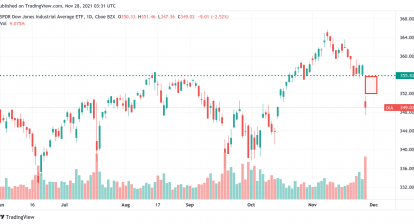
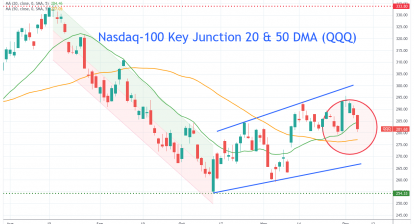
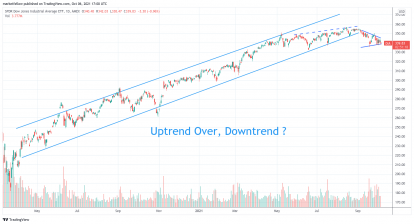
Chart with multiple stocks for performance comparison. Share This Post Have your say!10 Previous ArticleMajor Reversal and BreakdownNext ArticleNew Global Map You May Also Like Stock Chart: Technical Analysis with Moving Average and Volume (DIA) July 20, 2021 Weekend Summary: Stay Alert November 27, 2021 Stock Charts: Nasdaq Key Junction December 6, 2022 Stock Chart: Uptrend Over. Downtrend? October 6, 2021 Stock Chart Today: Deteriorated Breadth Indicator September 11, 2021 Stock Charts: Two Down, One To Go January 21, 2022 1 Comment benji January 28, 2020, 2:25 pm Thanks for sharing. Log in to reply Leave a Reply Cancel ReplyYou must be logged in to post a comment.

benji
Thanks for sharing.