December 16, 2022, 12:44 pm EST
All Trend Lines Bearish (SPY)
There is an easy way to know the trend or directions of the stock markets. It is not based on a personal opinion or unclear bias. Simply looking at the moving average lines will give a clear answer. This is the best part of the technical analysis that filters out personal opinions and confused data.
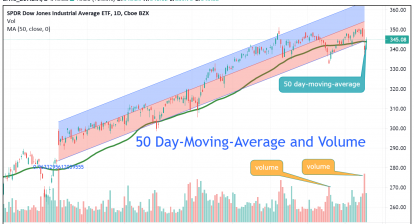
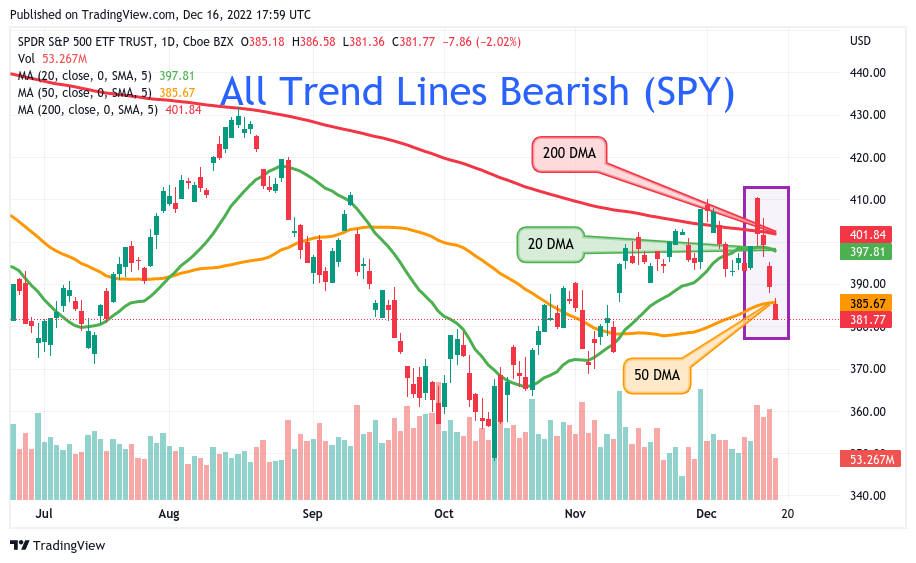
For example, we can apply three indicators of day-moving-average (DMA) lines to S&P 500 ETF (SPY) as shown in the featured chart for all trends:
- 20 DMA: short-term trend
- 50 DMA: medium-term trend
- 200 DMA: long-term trend
We can see that SPY is hit hard in the past four days of trading including today. All trend lines are broken. Thus, S&P 500 converts all bullish bias to bearish bias as a result in four days.
One of the best decisions in trading or investing is to follow the trend instead of going against the trend. Therefore, the investment strategy should be straightforward that is to stay conservative during the bearish cycle.