January 15, 2021, 10:31 am EST
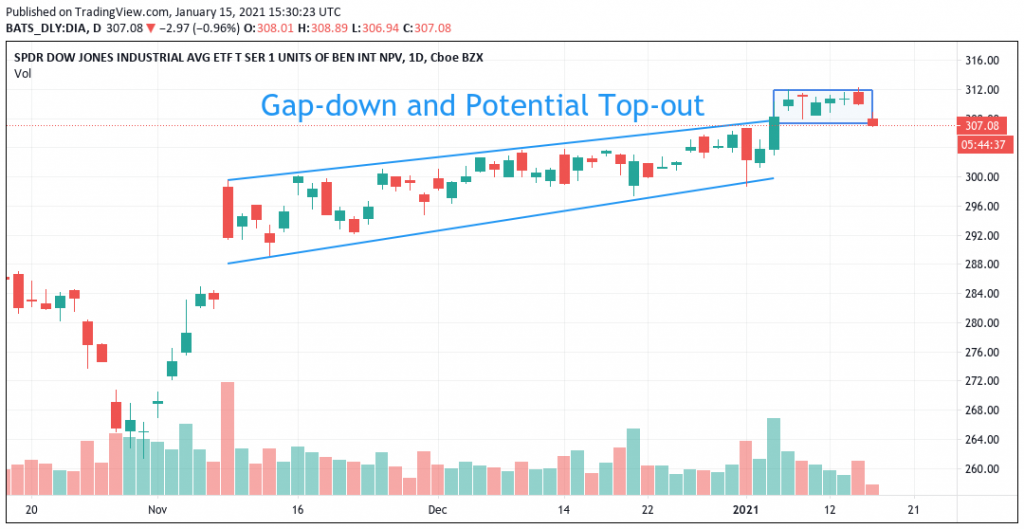
Gap-down and Potential Top-Out
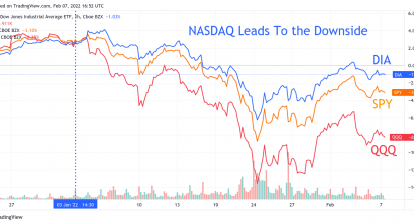
All indexes are down about -1% with DJIA declines -300 points. It is not a good sign after hovering at the top for 6 days. In fact, the bulls enter the 12th year that began in March 2009. We do not know exactly when it will happen but it is important to keep this in mind.
We need to monitor several factors all together to determine whether the bulls are really over. It includes events, charts, economic data, and market breadth, etc. We will get into it when the timing is ready.
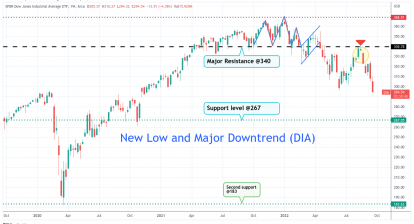
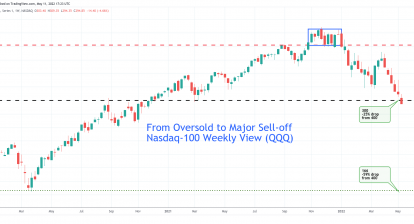
Meantime, watching DJIA (ETF: DIA) support line at 300 is the first step.