November 30, 2021, 11:29 am EST
Two Downs
How do we analyze the stock markets and give a bias, bullish or bearish? It bases on votes. For example, there are three major indexes that most traders or investors use which are Dow Jones, S&P 500, and Nasdaq. We can use these three indexes as a voting system to decide the bias of the markets.
The second question is “How do we judge individual index for the bias?” One easy way to see whether it makes a new high or a new low. Here, the high or low is according to a certain timeframe. It could be 52 weeks (one year) or a relatively high or low compared to the previous high or low.
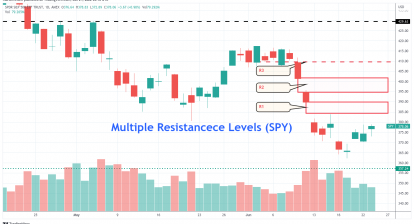
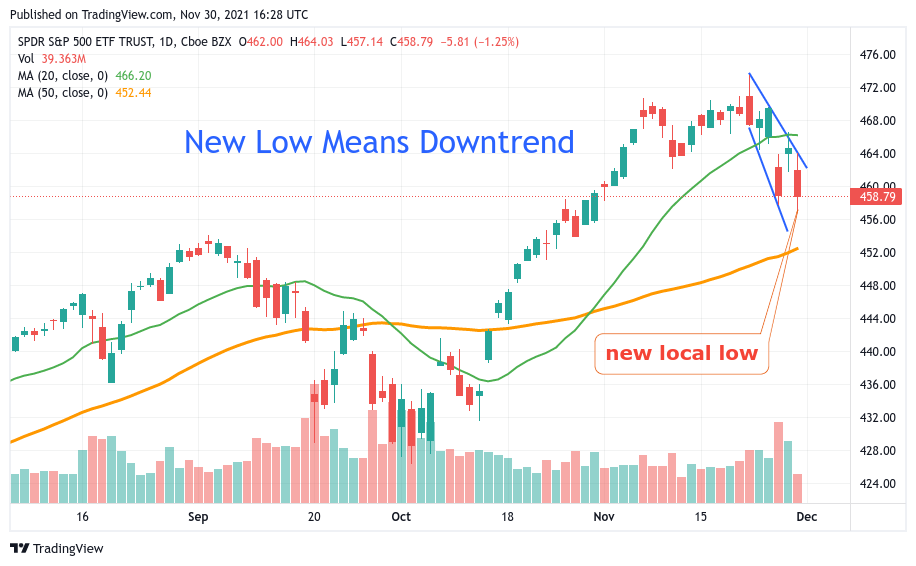
Take a look at the featured chart of S&P 500 ETF (SPY) we can see a new intra-day low is made which is lower than last Friday 11/26 fall. This is very meaningful because it confirmed the direction of the downtrend despite a rebound yesterday.
It is not the final verdict because there are still hours away from the closing bell today. However, it gave us a severe warning about the market condition. Dow Jones index is already in a firmed downtrend. If S&P 500 is also down, it tells us that two downs as the market bias for a bearish action.
Please pay attention to Nasdaq since it could quickly sink to the downtrend if bears keep getting stronger.
Having these pictures in mind helps us to make all necessary decisions on buying, holding, or selling. There should be different strategies for the bull market and bear markets that we should apply to protect our investments. Furthermore, there could be ways to take advantage of the down markets to make profits.
In summary, the stock markets seem to become bearish today and it could be the end of bulls that started in March 2009. So, it is time to be cautious and careful on portfolio management.