August 15, 2023, 11:02 am EDT
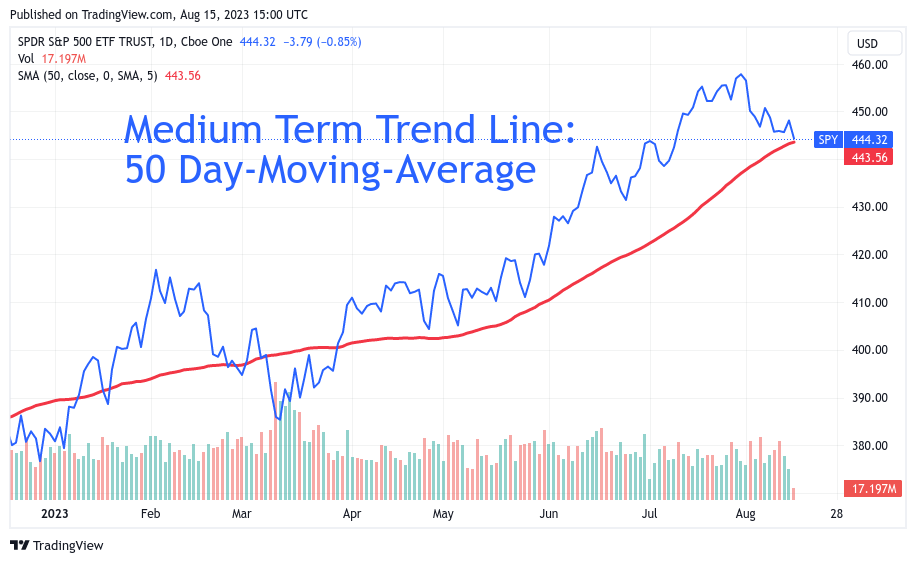
Medium Trend Line 50 Day-Moving-Average (SPY)
If your timeframe for profit on each trade is about a few weeks or months, then the medium trend would be very important for you.
Technically, one of the most popular used indicators for medium trend judgment is the 50-day-moving-average or 50-DMA.
If the stock or index is above 5-DMA, then it is in bullish bias. Below it means bearish bias. It is that simple. There should be no area for confusion.
One strategy that can be applied to use this indicator is to buy a stock when it crosses above 50-DMA. Or, it can be used to sell the stock when the stock crosses this line. Furthermore, one can use this line as one of the factors to decide whether to buy or sell a target stock.
In this example, we use S&P-500 ETF (SPY) to illustrate its usage as shown. As shown in the chart that we can see SPY is above its 50-DMA since March 2023 for about 5 months. One could get a solid +11% profit (from 400 to 444) when buying signal is triggered on March 29, 2023. Then, selling it to secure the gains when SPY is about to finish its journey today as the red line touched the SPY blue line.
Similarly, one can apply the same methodology for short-term 20-DMA or long-term 200-DMA with the same principle.
This method is simple yet effective and clear. Trading and investing itself is very complex and difficult. So, using the simple method to deal with it is a way to stay calm and apply discipline for consistency and risk control. Avoiding confusion or emotional decision is one of the most important criteria when putting hard-earn money into the investment battlefield.