February 9, 2023, 9:00 pm EST
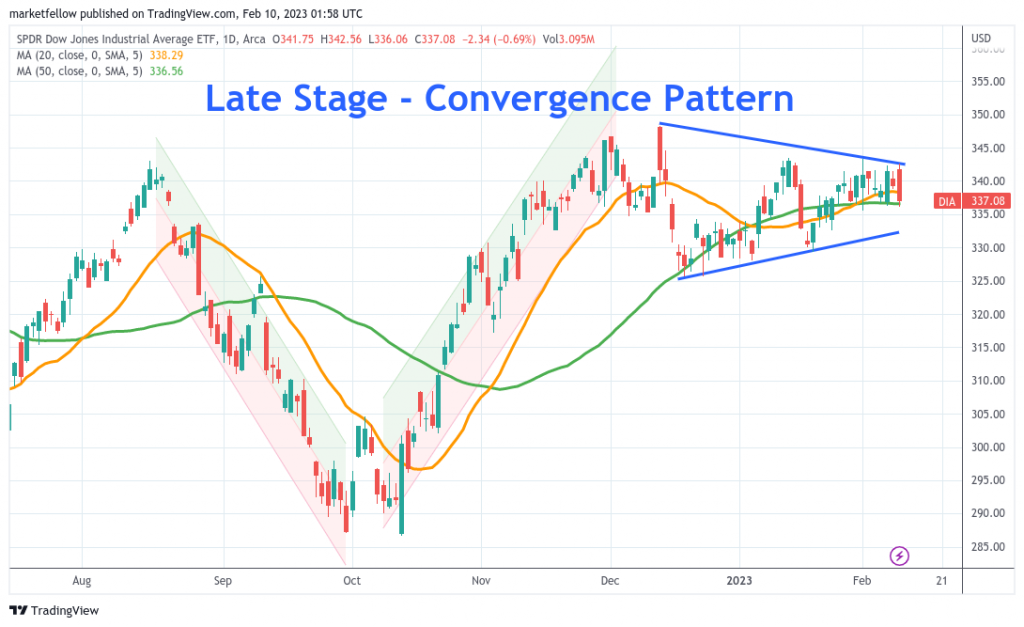
Late Stage – Convergence Pattern (DIA)
The Dow Jones index has been on a sideway since last December 2022 as shown. This convergence pattern took place after wild down-and-up rollercoaster rides for the prior 3-4 months. Thus, it is important to be alert to speculate on what could be the next move.
The convergence pattern gave us a hint that we are at a late stage of the pattern. It is because both the upper bound and lower bound became narrower compared to 2 months ago.
Thus, it is important to be ready when either edge is broken which could set the tone for the next move. Sometimes, there could also be a fake-head condition where the first move is not the real action. Thus, we need to be sensitive and careful to judge the next trend.
Notice 20 (orange line) & 50 (green line) day-moving-average lines are also merged together. Therefore, either breaking out to the upside or breaking down to the downside is going to be meaningful from the technical analysis perspective.
At this moment, it would be better to stay neutral so that one can switch sides more quicker. When Dow Jones moves out of the convergence pattern, it is necessary to make a timely judgment in order to ride in the same direction as the market itself.