December 31, 2020, 1:19 pm EST
Staging Breakout and Uptrend – Mosaic (MOS)
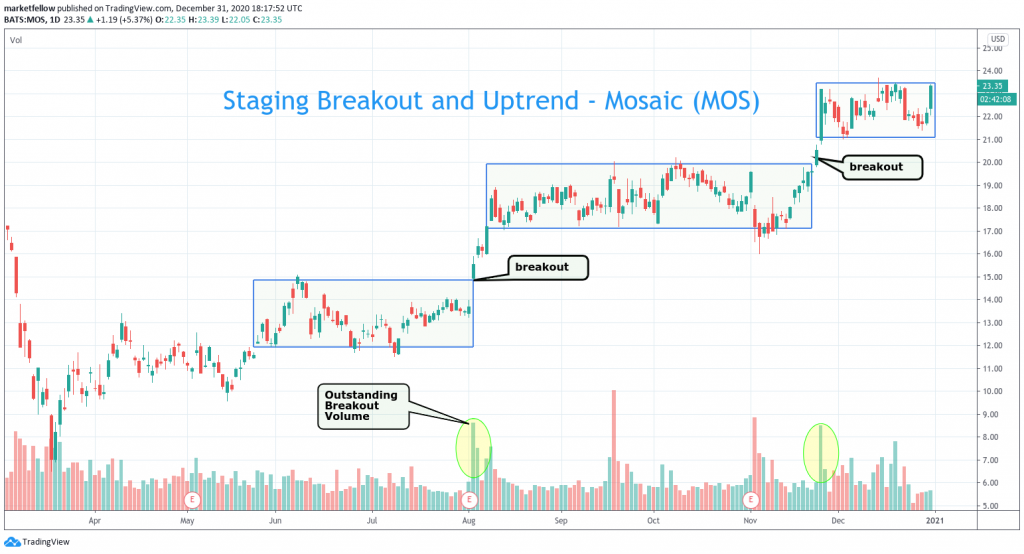
Staging breakout is one of the most predictable patterns for sustainable uptrend. It could generate multiple entry points for each level when advancing to the next level. We will use Mosaic as an example to demonstrate how to identify this set up and how to make profits out of it.
- Rectangle patterns could be identified by sideway actions with well-defined top and bottom. In this example, MOS made two bases, one is June-July and the other August – November.
- We successfully got +31% profits from its second base as documented in our 11/30 article “2020 Actual Trade: MOS +31% Profits”.
- Now, MOS could setup it again for potential breakout out of this box about 23.35 final resistance
- There are two strategies to use. First, get in around this level around 23.35 in expecting a breakout. The benefit of this approach is that it will not miss any gap-up or breakout if it happens. However, if break out does not occur, minor pullback could drag on another sideway movement. Sell stop should be set at lower boundary 21 for risk management.
- The other method is to watch it closely. Get it as soon it crosses through its ceiling 23.25. This approach will definitely get the highest level of upside momentum when entering in. But the drawback is that it could get a higher entry point. Especially, if a gap-up arrives with a 5% or 10% jump, then you are paying premium to hold this position.
- A strong stock could make 4 – 5 bases or even more for 6 months or years time frames.
- Another key point is to look at stable, low volatility characteristics of underlying stocks that is more suitable for this strategy