August 17, 2022, 11:55 am EDT
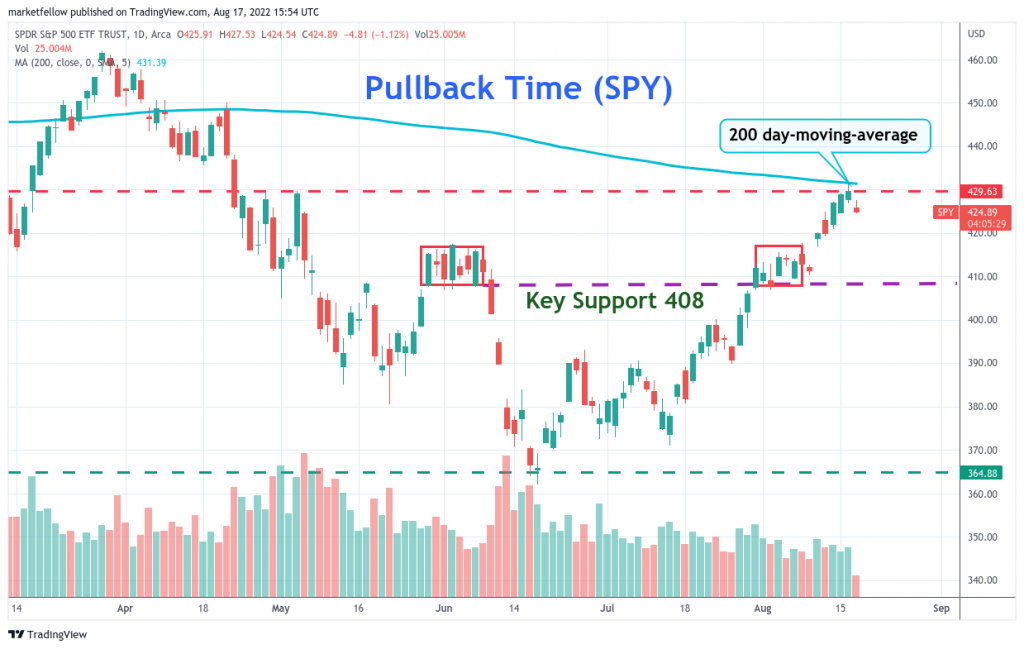
Pullback Time (SPY)
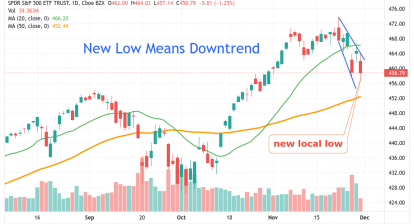
After impressive +18% gains for the S&P 500 (SPY) in the past two months, the stock market pulled back today. Technically, it was blocked by its 200-day-moving-average (200 DMA)line as shown.
The important thing to grasp here is that all major indexes made a strong rebound. Both short-term (20 DMA) and medium-term (50 DMA) were recovered. However, the long-term view, justified by its 200 DMA, is still negative. It reminds us to stay cautious.
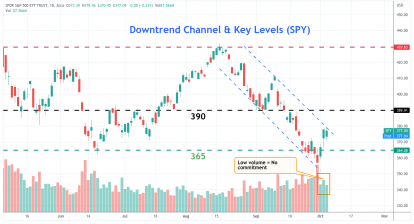
The next measurement of the strength for SPY will be 408 level which marked the previous stalled line. If S&P can hold this line above, then bulls may have another chance. Otherwise, falling below 408 indicates its failure that could reset SPY to its previous bottom at 365.