Charts
Chart pattern, indicators, drawing, etc
Stock Charts: Technology Lags Behind
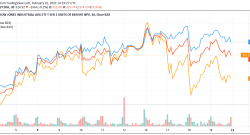
February 22, 2021, 9:20 am EST Technology Lags Behind Technology lags behind Dow Jones and S&P index since 02/16 as shown in the featured chart (QQQ-orange, SPY-red, DIA-blue). AAPL, TSLA, FB, MS...
Stock Charts: Gap-down and Potential Top-Out
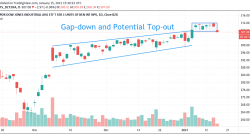
January 15, 2021, 10:31 am EST Gap-down and Potential Top-Out All indexes are down about -1% with DJIA declines -300 points. It is not a good sign after hovering at the top for 6 days. In fact, the bu...
Stock Charts: Where is the Volume ?
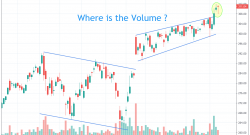
January 9, 2021, 10:28 am EST Where is the Volume ? Higher volume means higher momentum. When you go shopping and you see a lot of crowds there, you know there must be something exciting, either hot p...
Stock Chart: Intraday Reversal and Breakdown
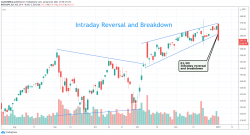
January 4, 2021, 12:51 pm EST Intraday Reversal and Breakdown Stock markets opened with a new high record high but it did not last very long. Markets quickly turned direction to the downside with all ...
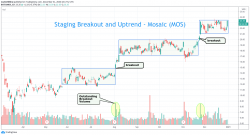
Stock Charts: Staging Breakout and Uptrend – Mosaic (MOS)
December 31, 2020, 1:19 pm EST Staging Breakout and Uptrend – Mosaic (MOS) Staging breakout is one of the most predictable patterns for sustainable uptrend. It could generate multiple entry poin...
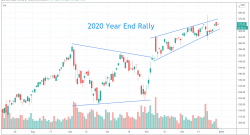
Stock Chart: 2020 Year End Rally
December 30, 2020, 10:21 am EST 2020 Year End Rally Stock market squeezed its power for the last few trading days of 2020 to a new high zone. New highs always mean bullish but it is also important to ...
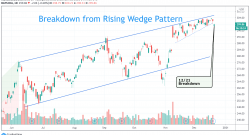
Stock Charts: Breakdown From Rising Wedge Pattern
December 21, 2020, 10:21 am EST Breakdown From Rising Wedge Pattern Stock markets made another rally about +15% gain for major indexes (ex: DIA from 264 to 304) in less than two month period (November...
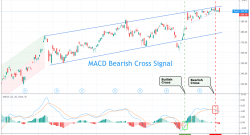
Stock Chart: MACD Bearish Cross Signal
December 14, 2020, 7:27 pm EST MACD Bearish Cross Signal There are hundreds of technical indicators for technical (or chart) analysis for the stock markets. Moving average convergence divergence (MAC...
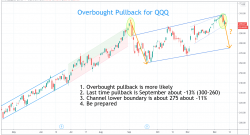
Stock Chart: Overbought Pullback
December 11, 2020, 12:21 pm EST Overbought Pullback It is important to use technical analysis to gauge the status of current market conditions. Stock market has its own rhythms for going up and down s...

